What happens when the sawmill stops and nobody records why
There is a scene that repeats itself in many sawmills: the line stops, the supervisor looks at the floor, the crew stands idle and nobody knows exactly how many minutes the machine has been down. At the end of the shift, someone writes “electrical stop” on paper, with no time, no duration and no root cause. Common as it is, this is exactly the problem that sawmill production control exists to solve.
It is not a communication problem. It is a production control problem.
For managers and directors, the lack of accurate line data is one of the main barriers to growing consistently. For operators and supervisors, it means not knowing whether the day’s pace is on or off target. Both sides suffer from the same gap: no real-time visibility into what is happening in production.
In this article, you will see how sawmill production control works in practice, which indicators really matter and what real data from a lumber company in Paraná, Brazil, reveals about the gains this change can bring.
Why manual control is not enough for a competitive sawmill
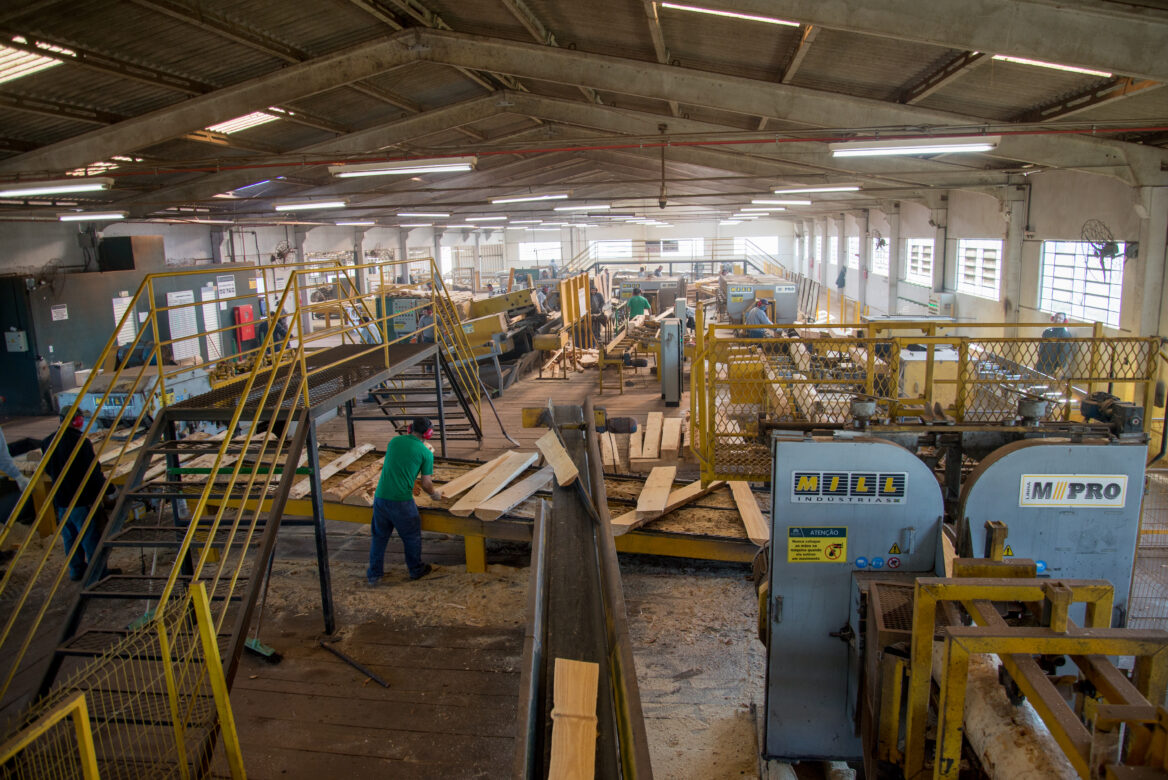
It is still common to find sawmills that log production by hand, pull data together in isolated spreadsheets and make decisions by eye, with no consolidated indicators, no downtime analysis and no raw material traceability.
That model works up to a point, but it has clear limits:
- Logging errors distort reports and lead to wrong decisions.
- Without traceability, you cannot tell which supplier delivers the poorest logs.
- Without real-time data, managers are always reactive, solving problems after they have already had an impact.
- Perceptions of the line tend to be inflated: many managers believe the machine runs 60% to 70% of the available time, when the reality is often well below that.
Raw material is also a large share of a sawmill’s industrial cost. According to IBFlorestas, about 35% of the cost of producing sawn lumber is the log itself. With that much at stake, any inefficiency in raw material use hits the operation’s margin directly.
Accurate control starts before the first cut: in the log yard, in log grading and in recording diameters and lengths, information that, without a proper system, is lost before it even reaches a report.
What OEE is and why it is the right indicator for sawmill production control
In industry, the most widely used indicator of a production line’s overall efficiency is OEE (Overall Equipment Effectiveness), which combines three dimensions: availability, performance and quality.
In sawmills, the same concept is applied as OAE (Overall Asset Effectiveness), with the same three dimensions adapted to log breakdown:
| Dimension | What it measures | Practical example |
|---|---|---|
| Availability | Share of time the line actually runs, without stops | The line is available for 8 h but actually runs 5 h: 62.5% availability |
| Performance | Whether the machine runs at full capacity while it is running | The line runs, but slowly: 80% performance |
| Quality | Share of pieces produced within standards | 10% of logs out of spec: 90% quality |
OAE is the product of these three metrics. A line with 62.5% availability, 80% performance and 90% quality therefore runs at an OAE of only 45%: almost half of its productive potential is lost in one of the three pillars.
Manufacturing benchmarks consider an OEE of 85% world class, while 60% is typical for the industry, which still leaves plenty of room for improvement. For sawmills that have never measured these numbers, discovering their real starting point is often a shock. The methodology is widely endorsed by organizations such as Lean Institute Brasil, which recommends OEE as the basis for continuous improvement programs in manufacturing.
Availability: the number most sawmills do not know
In practice, line availability is the first indicator that reveals what is really happening in an operation. And it is usually much lower than managers estimate.
A study of a mid-sized sawmill in Curitibanos (Santa Catarina, Brazil), published by the Federal University of Santa Catarina, found that only 66.9% of scheduled machine hours were actually productive, with mechanical availability of 92.8%. Saw changes were among the main causes of downtime, accounting for 28.6% of stopped time.
This shows something important: a machine being mechanically available does not mean it is producing. Operational stops, lack of raw material, waiting for an operator and setup adjustments all eat into productive time, often without the manager having any accurate record.
How production control changes downtime management in the sawmill
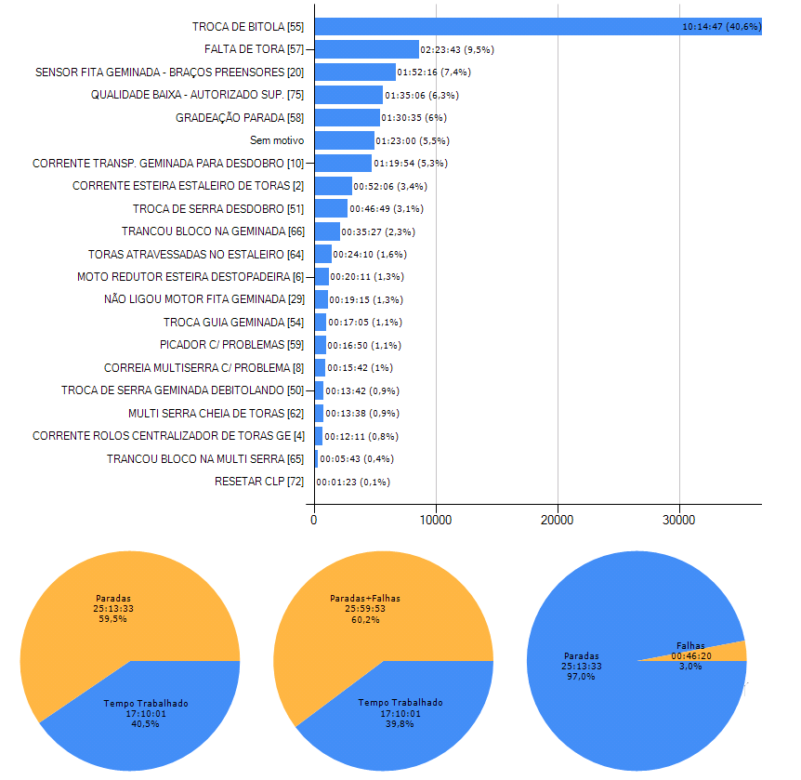
When the operator logs every stop in real time, with a cause code, start time and restart time, the sawmill gets an accurate map of its losses.
By applying a Pareto chart to that map, managers can identify the three or four reasons for downtime that hurt availability most, and focus action exactly where the impact is greatest.
Without that record, the problem stays invisible. With it, decisions are based on evidence, not perception.
Real result: from 45% to 55–60% availability in one year
Madeireira Galego, from Tunas do Paraná, implemented Pro X, Marrari’s sawmill production controller, about a year ago. The operation’s experience shows, with concrete data, what production control can change in practice.
Before implementation, the internal estimate was that the line was sawing around 60% to 70% of the available time. It was a reasonable perception: the line seemed to be running most of the day.
When the system started measuring accurately, the real figure was only 45% availability.
“It was a shock, a real shock,” is how the operation sums it up. But that shock is the first step toward improvement: without real data, the problem does not formally exist, so it cannot be solved.
By mapping downtime and using a Pareto chart to prioritize the most frequent causes, the operation raised average availability over the first year. The table below summarizes the main results:
| Indicator | Before Pro X | After 1 year with Pro X | Change |
|---|---|---|---|
| Line availability | ~45% | 55% to 60% | +10 to +15 pp |
| Perception vs. reality | 60–70% (estimate) | 55–60% (measured) | Gap eliminated |
| Daily production variability | High (no root cause) | Reduced (cause identified) | More predictable output |
| Basis for production meetings | Anecdotes and memory | Structured data (OAE, Pareto) | Evidence-based decisions |
| Supplier negotiations | Subjective | Based on actual yield per batch | Stronger bargaining position |
That is an increase of up to 15 percentage points in availability, which, for a line with volume targets, has a direct impact on revenue.
Beyond the average, another significant result was lower production variability. Before, there were high-output and low-output days with no clear cause. With sawmill production control, the “bad” days now have an identified cause, so they can be addressed systematically.
Raw material: production control shows which suppliers really deliver quality
One of the most underestimated aspects of sawmill production control is raw material quality. Informal assessment, along the lines of “this log looks good”, is subjective, occasional and based on visual inspection.
The problem is that raw material accounts for more than a third of the operation’s industrial cost. A log with an out-of-spec diameter, irregular length or excessive taper directly affects sawing yield and, consequently, the revenue generated per cubic meter processed.
Studies published in the UFPR journal Floresta show that log sawing yield can vary considerably with log diameter and characteristics. Careful control of these variables is therefore one of the main levers for gaining productivity without investing in more machinery.
With an integrated production control system, every log processed is recorded with its diameters and lengths. The system automatically flags any piece outside the specification set for that production order. In the end, the sawmill has a log-by-log report, by supplier and by batch, with the actual yield from each raw material source.
At Madeireira Galego, this led to a strategic result: the ability to negotiate with suppliers based on data. Suppliers whose logs meet the spec deliver better conversion, which can justify a more competitive price. Suppliers with inconsistent quality, on the other hand, now have hard proof that their raw material hurts the operation, with numbers instead of perceptions.
Performance: the line is running, but at full capacity?
Availability measures how long the line runs. Performance measures how it runs while it is active.
A line can log 8 hours of operation and still underperform, because the operator works at reduced speed, because the machine needs frequent adjustments between logs, or because there are micro-stops that never get formally recorded but still eat into productive time.
This indicator requires the control system to compare actual operating speed with the line’s rated capacity. The difference between the two is the performance loss.
In practice, a sawmill can show 80% availability and only 60% performance, meaning that much of the time the line was running, it ran below its potential. The product of these two metrics already represents a considerable loss, even before quality comes into play.
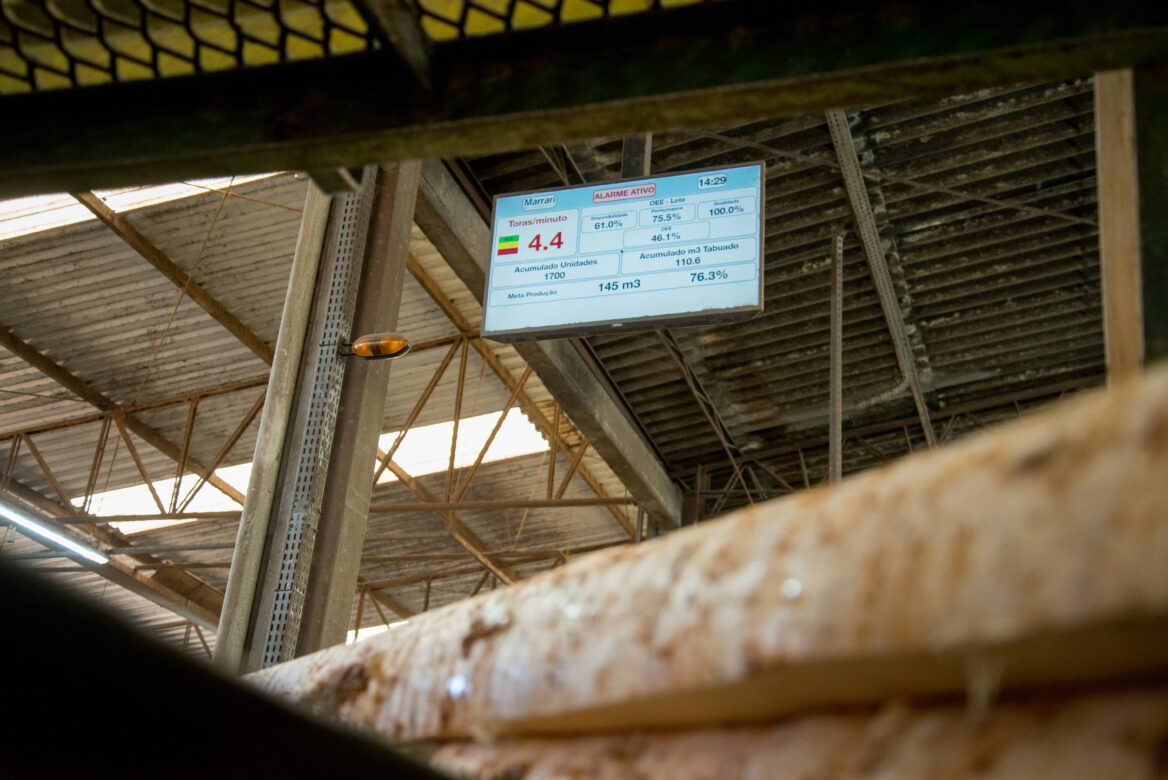
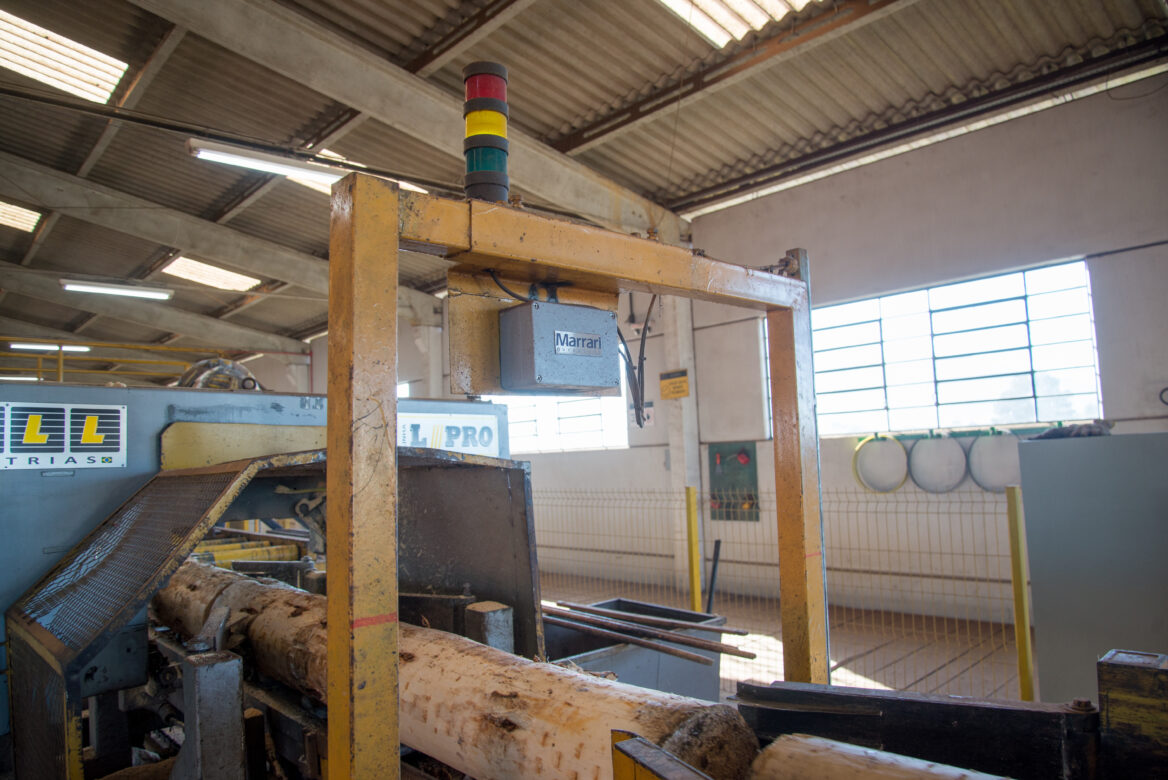
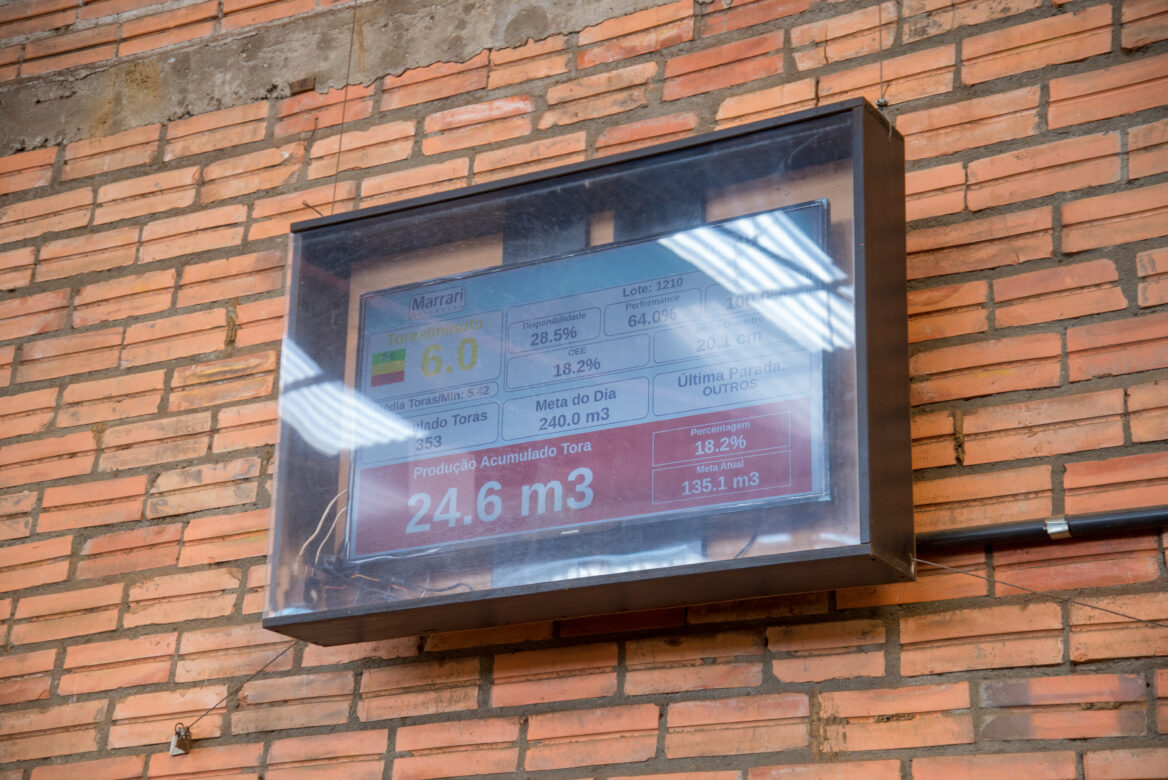
Making this indicator visible every day, on an andon board at the line or a dashboard on the phone, lets operators monitor their own pace and adjust speed during the shift, without someone having to push them.
The role of visual management in sawmill production control: from management to the operator
A sawmill production control system is not just a management tool. It also has a direct operational role: telling people on the floor whether production is on track.
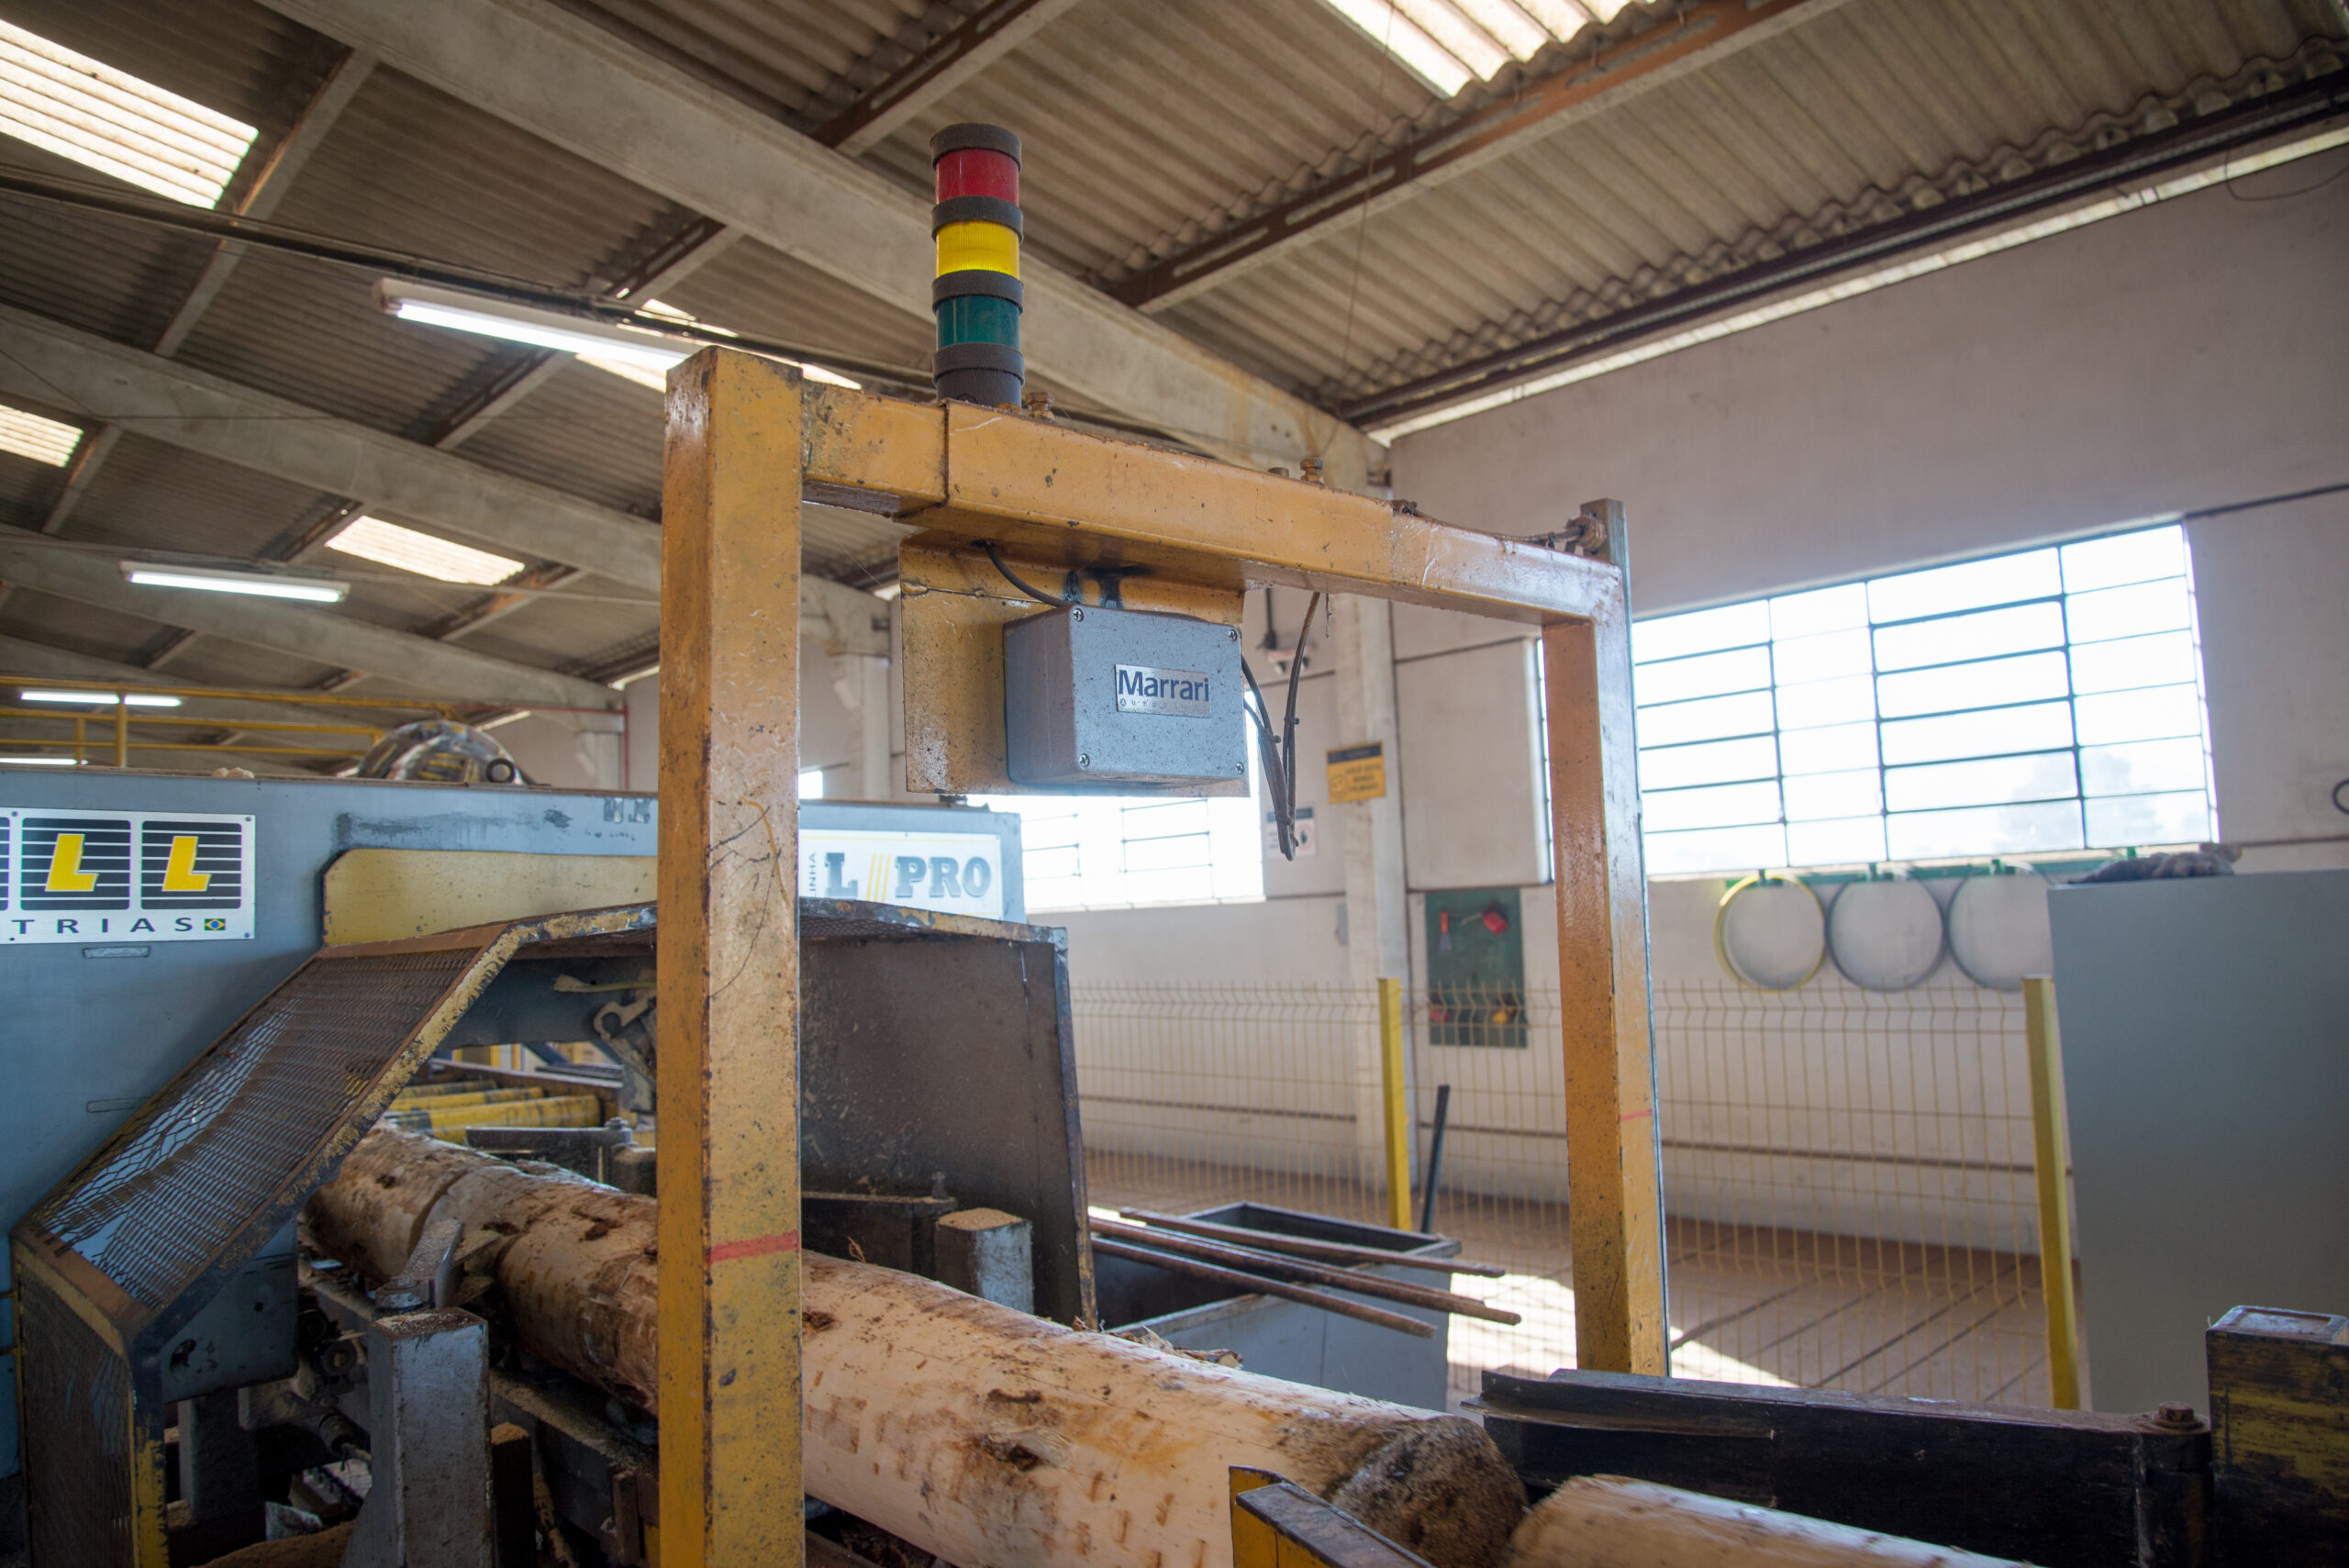
The andon, a visual board installed at the start of the line, shows operators in real time whether they are on target (green), close to the limit (yellow) or below expectations (red). This immediate feedback naturally changes behavior: operators know what to do without waiting for the end-of-day report.
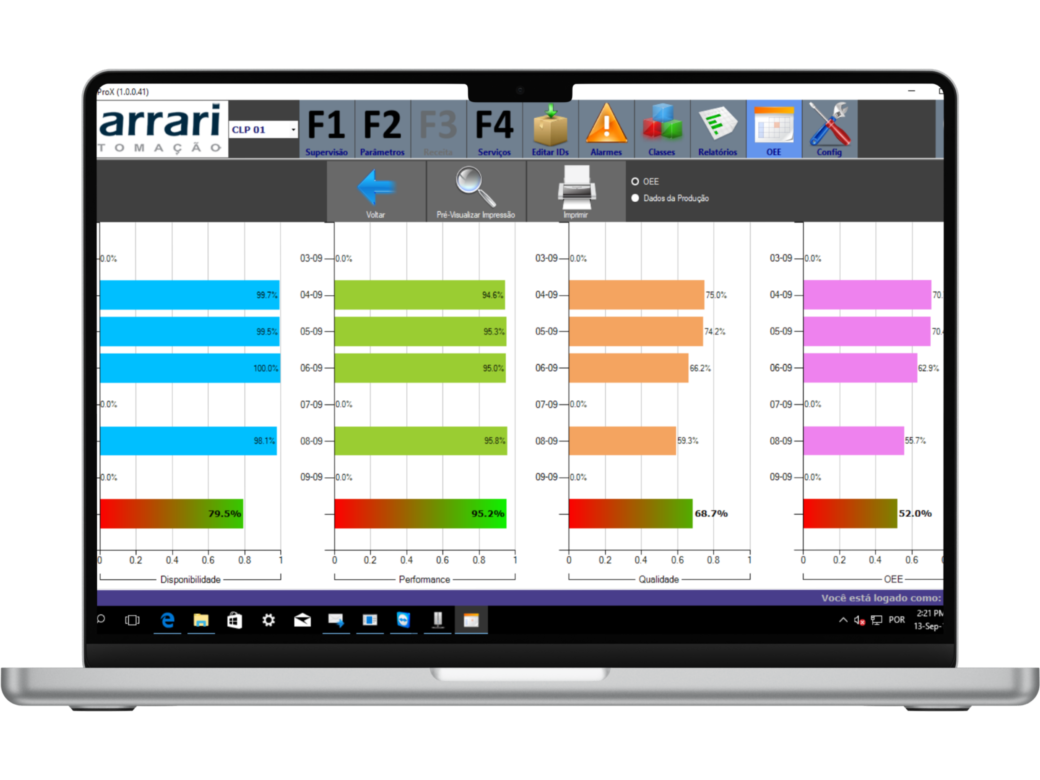
The full dashboard, with availability, performance, quality, target and cumulative output, can be shown on a screen the whole line crew can see. This builds collective ownership of results: employees stop seeing the numbers as something abstract from management and understand that the data reflects their work.
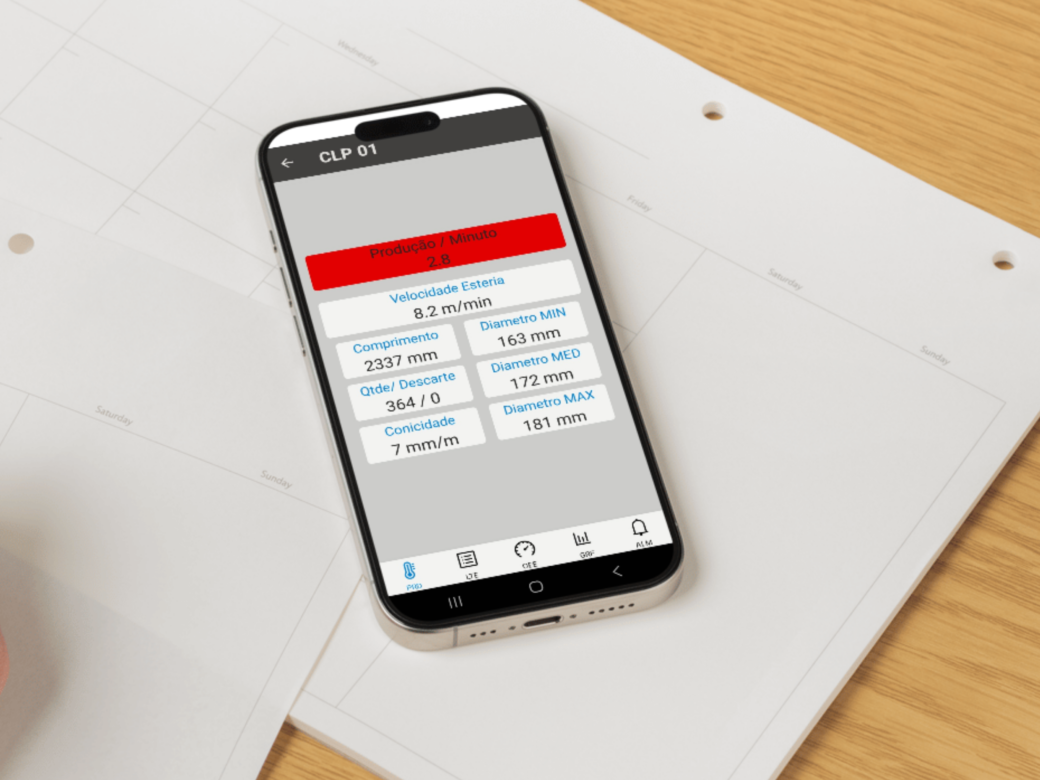
And when the system is accessible from a phone, supervisors can follow the line in real time from anywhere, even off-site, and act before a situation gets worse.
This combination of data for management and visibility for operations is what sets a production control system apart from simple reporting software.
Production meetings: how production control changes the agenda
When a sawmill has no structured data, production meetings tend to rely on memory, perception and anecdotes: “I think it was a good week.” “There were a lot of stops on Tuesday.” “Supplier X delivered some crooked logs.”
With an integrated production control system, that changes completely. Weekly, monthly and annual meetings are now based on:
- Availability charts by period
- Ranking of downtime causes (Pareto)
- Yield comparison by supplier
- OEE trend over time
- Target vs. actual by shift and by operator
This does not replace people’s experience; it complements it. The supervisor who knows that “Thursday is usually bad” now has the data to show why and to propose evidence-based solutions.
For directors and managers, this changes their relationship with the operation: decisions on where to invest, what to fix and how to prioritize are backed by numbers, not just gut feeling.
Sawmill production control in practice: what Pro X offers
Pro X is a production controller developed by Marrari Automação specifically for industrial sawmills. Unlike generic industrial management solutions, it was designed for the realities of log breakdown, with varying species, diameters and multiple shifts.
| Feature | What it solves |
|---|---|
| Automatic data collection by area, machine or operator | Eliminates manual logs and recording errors |
| Real-time downtime logging with cause codes | Builds the downtime map for Pareto analysis |
| Log-by-log raw material records | Lets you compare actual yield by supplier and batch |
| Dashboard with OAE, availability, performance and quality | A complete view of the line for managers at any time |
| Andon at the line (green/yellow/red) | Operators know whether they are on target without relying on a supervisor |
| Mobile access | Supervisors follow the line in real time from anywhere |
| Automatic, exportable reports | Ready-made input for weekly, monthly and annual meetings |
| Compatibility with Marrari sensors | More accurate measurement built into production control |
Implementation includes an analysis of the operation, configuration of line parameters and team training, so the system starts producing useful data from day one instead of sitting unused.
The number nobody wants to find out, but every sawmill needs to know
There is a common reluctance to measure an operation’s real efficiency. Deep down, nobody wants to learn that the line runs 45% of the time when everyone believed it was 65%.
Yet that number is the starting point for any real improvement.
Without it, the sawmill keeps making decisions in the dark: investing in the wrong places, tolerating avoidable stops and buying raw material from suppliers who hurt yield without anyone noticing.
With it, the operation gains control over what it produces, why it stops, how it performs and where variation in results comes from. That means more consistency, less waste and a solid foundation for growth.
Sawmill production control is not a tool for pressure. It is a tool for visibility, for managers who want to make better decisions and for operators who want to know whether they are on track.
References
- IBFlorestas. Yield in converting logs into sawn lumber. 2023 (in Portuguese).
- BASTOS, S. L. S. Desempenho operacional de serraria de médio porte. UFSC, Curitibanos Campus, 2023.
- Revista Floresta UFPR. Rendimento em madeira serrada, v. 37, n. 1, 2007.
- SILVA, A. C. Aplicação do indicador OEE para análise do desempenho global da capacidade produtiva de uma indústria madeireira. Master’s thesis, UFPA, 2019.
- International Federation of Robotics (IFR). World Robotics Report, 2023.
- CBCTEM. Quantificação de resíduos madeireiros de uma serraria, 2019.
- Marrari Automação. Serrarias: Automação e Modernização (in Portuguese). 2026.
- Marrari Automação. Serraria: Por que digitalizar a produção? (in Portuguese). 2025.
Want to apply this in your plant?
Talk to a Marrari specialist on WhatsApp or see the right solution for your process.